
There is an immense pressure on researchers to be published in the journals “that matter”. This is a brief overview of some of what might be useful to know when approaching journals. Alternatively if you know the editor of a journal all of this might be taken care of. You might prefer to go to a more independently run (or owned) journal.
How do you choose a journal?
Here are some tips from Elsevier, which will be similar to what you would do for Springer and other major journal producing powerhouses. Here is a brief summary:
Check the references in your article to find potential journals.
Read the journal’s homepage for its scope.
Especially important, download the journal’s guide for authors (or keep the link handy).
Check articles are by invitation only;
Check review and publication timelines (page 5).
If you need to publish open access, most Elsevier journals explain their open access options on the journal homepage (page 6).
Submit your paper to only one journal at a time (page 14, on ethics).
The journal finder tool locates Elsevier journals that most closely match your abstract. An Elsevier journal will be recommended if it has published articles that are highly similar to your article. A list of relevant articles is generated, and the tool can filter on your preferred criteria, such as open access options, journal metrics, review time, acceptance rate and production time.
What do impact metrics really mean?
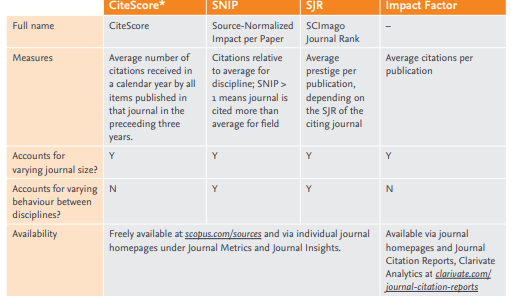
The average impact of all the articles in a journal is often used as a proxy for the impact of a specific article – especially when the article hasn’t yet had time to accumulate its own citations. All the methods seem to have their pluses and minuses. You would have seen the table below at the top of this blog. Here are how some of the common metrics are worked out:
It looks a bit more complicated at Wiley. A couple of the metric methods are the same as two above (SNIP and SJR). The table below comes from Wiley’s information:
The “JCR Year” refers to the journal citation report year, which is the individual year for which a metric is provided.
| Metric Name | Metric Source | Metric Description |
| Impact Factor | Web of Science | The Impact Factor is the average number of times articles from the journal published in the past two years have been cited in the JCR year. The Impact Factor is calculated by dividing the number of citations in the JCR year by the total number of articles published in the two previous years. |
| 5-Year Impact Factor | Web of Science | The 5-year Impact Factor is the average number of times articles from the journal published in the past five years have been cited in the JCR year. It is calculated by dividing the number of citations in the JCR year by the total number of articles published in the five previous years. |
| Altmetrics | (Any source) | Altmetrics go beyond more traditional citation metrics to measure social visibility around scientific articles. These metrics are based on a broad spectrum of indicators, such as tweets, blog mentions, news media, social bookmarking, article views, and downloads. |
| Eigenfactor | Web of Science | The Eigenfactor is based on weighted citations in the JCR year to papers published within the previous 5 years. Citations are weighted according to the prestige of the citing journal, with citations from highly ranked journals making a larger contribution to the Eigenfactor than those from poorly ranked journals. |
| Google Scholar Metrics | Google Scholar | The main Google Scholar journal metric is the H5 index and is based on articles published in the last 5 complete calendar years. This is similar to the h-Index but also includes the top cited h articles (h-core) and the median of the citation counts (h-median). |
| h-index | Web of Science, Google Scholar, or Scopus | The h-index attempts to measure the productivity and citation impact of the published body of work of an author. The h-index indicates the number of papers, h, that have been cited at least htimes (e.g. an h-index of 15 means that 15 papers have been cited at least 15 times each.) Note: Due to variations in citation coverage between databases, each source may determine a different value of the h-index for each author. |
| Immediacy Index | Web of Science | The Immediacy Index is the average number of times an article is cited in the year it is published. The Immediacy Index is calculated by dividing the number of citations to articles published in a given year by the number of articles published in that year. |
| SJR | Scopus | The SCImago Journal Rank (SJR) Indicator is based on weighted citations in Year X to papers published in the previous 3 years. Citations are weighted by the prestige of the citing journal, so that a citation from a top journal will have more impact than a citation from a low-ranked journal. |
| SNIP | Scopus | The Source Normalized Impact per Paper (SNIP) measures average citations in Year X to papers published in the previous 3 years. Citations are weighted by the citation potential of the journal’s subject category, thereby making the metric more comparable across different disciplines. |
Well that was a lot of information.
The message is:
there is no clear way to assess the number of citations.